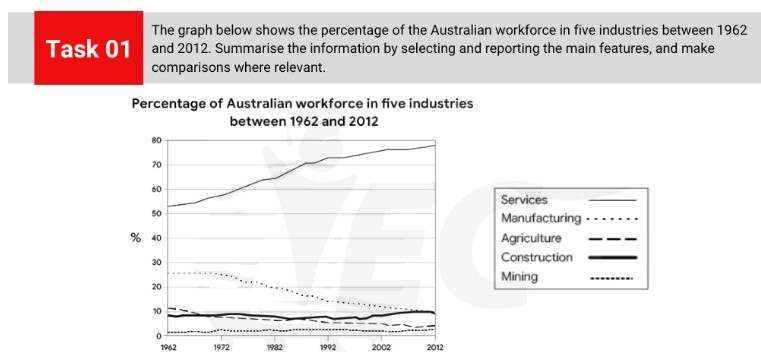


The line chart details the percentage of workers in Australia according to 5 different industries from 1962 a 2012. Looking from an overall perspective, it is readily apparent that the most noticeable growth and the vast majority of jobs was concentrated in the services industry. There was decline in the workforce for jobs in agriculture and manufacturing, and slight rises for the remaining two industries.
En 1962, approximately 52% of Australians worked in services, a figure far above the next closest sector, fabricación (27%). From that point onwards, service jobs grew rapidly to reach 72% por 1992 and then growth tapered off and rose more moderately to finish the period at just under 80%. A diferencia de, manufacturing as an employment option was stable over the first decade before a consistent decline led to a final figure of 10% en 2012.
In terms of the less common jobs, agricultural workers declined at steady intervals from just above 10% en 1962 to a low of 4% en 2012. In comparison, mining and construction jobs were generally stable with minor growth, rising from 9% y 1% a 10% y 2%, respectivamente.
Analysis
1. The line chart details the percentage of workers in Australia according to 5 different industries from 1962 to 2012.2. Looking from an overall perspective, it is readily apparent that the most noticeable growth and the vast majority of jobs was concentrated in the services industry.3. There was decline in the workforce for jobs in agriculture and manufacturing, and slight rises for the remaining two industries.
- Paraphrase what the bar chart shows.
- Write a clear overview summarising the differences and the overall trend.
- This one is a little complex so it needs a second sentence for the overview.
1. En 1962, approximately 52% of Australians worked in services, a figure far above the next closest sector, fabricación (27%). 2. From that point onwards, service jobs grew rapidly to reach 72% por 1992 and then growth tapered off and rose more moderately to finish the period at just under 80%. 3. A diferencia de, manufacturing as an employment option was stable over the first decade before a consistent decline led to a final figure of 10% en 2012.
- Begin writing about the data for the first categories.
- Compare between each sentence.
- Add in all the data.
1. In terms of the less common jobs, agricultural workers declined at steady intervals from just above 10% en 1962 to a low of 4% in 2012.2. In comparison, mining and construction jobs were generally stable with minor growth, rising from 9% y 1% a 10% y 2%, respectivamente.
- Write about the final other parts of the graph – include everything!
- Include all the data.
Vocabulary
What do the words in bold below mean? Make some notes on paper to aid memory and then check below.
The line chart details the percentage of workers in Australiaaccording to 5 differentindustriesde 1962 to 2012.Looking from an overall perspective, it is readily apparent that lamost noticeable growth ythe vast majority of jobs wasconcentrated inthe services industry. There wasdeclineen elworkforcefor jobs inagricultureyfabricación, yslight rises forlaremaining two industries.
In 1962,approximately52% of Australians worked in services, a figure far above la next closest sector, fabricación (27%). From that point onwards, service jobs grew rapidly to reach72% por 1992 and thengrowth tapered off y rose more moderately to finish the period atjust under 80%.A diferencia de, manufacturing as anemployment optionwasstableover thefirst decade before a consistent decline led to a final figure of 10% en 2012.
In terms of the less common jobs, agricultural workers declined at steady intervals from just above 10% en 1962 to a low of 4% en 2012. In comparison, miningyconstructionjobs weregenerally stable con minor growth, rising from 9% y 1% a 10% y 2%, respectivamente.
respuestas
For extra practice, write an antonym (opposite word) on a piece of paper to help you remember the new vocabulary:
according to – as per, in accordance with, based on
industries – sectors, fields, trades
most noticeable growth – significant expansion, prominent increase, marked development
the vast majority of – the overwhelming majority of, the lion’s share of, the bulk of
concentrated in – focused in, centered on, predominantly located in
decline – decrease, drop, downturn
workforce – labor force, empleados, personnel
agriculture – farming, cultivation, agronomy
manufacturing – production, fabrication, assembly
slight rises for – marginal increases in, modest growth for, minor upturns in
remaining two industries – the other two sectors, the rest of the industries
approximately – roughly, acerca de, alrededor
a figure far above – a number significantly higher than, a value well beyond
next closest sector – nearest industry, adjacent sector, the following closest field
From that point onwards – From then on, from that moment forward, starting from that point
grew rapidly to reach – expanded swiftly to attain, experienced rapid growth to achieve, developed quickly and reached
growth tapered off – expansion leveled off, increase gradually slowed down, growth decelerated
rose more moderately to finish the period at – increased at a more moderate pace to conclude the period at, grew more steadily and ended the timeframe at
In contrast – On the other hand, conversely, in opposition
employment option – job opportunity, career choice, work alternative
stable – steady, consistent, unchanging
first decade – initial ten years, opening period, the initial phase
before a consistent decline – prior to a continuous decrease, preceding a steady downturn, before a sustained drop
led to – resulted in, caused, brought about
a final figure of – a concluding number of, a last value of, a ultimate figure of
In terms of – With regard to, concerning, regarding
In comparison – By comparison, when comparing, contrasted with
mining – extraction, excavation, mining industry
construction – building, erection, construction sector
generally stable – mostly consistent, predominantly steady, largely unchanging
minor growth – slight expansion, modest increase, marginal development
rising from – increasing from, ascending from, going up from
Vocabulary Practice
I recommend getting a pencil and piece of paper because that aids memory. Then write down the missing vocabulary from my sample answer in your notebook:
The line chart details the percentage of workers in Australiaa_____________o 5 differenti_________sde 1962 to 2012.L______________________________________________________________t lam__________________h yt____________________f jobs wasc__________________nthe services industry. There wasd_________een elw_________efor jobs ina_________eym____________g, ys______________________rlar________________s.
In 1962,a_________________y52% of Australians worked in services, a___________________e la n_________________r, fabricación (27%). F__________________________s, service jobs g_____________________h72% por 1992 and theng____________________f y r_______________________________________________tjust under 80%.yo___________t, manufacturing as ane_________________nwasstableover thef_______________mi b_________________________e l_________________________f 10% en 2012.
I____________f the less common jobs, agricultural workers declined at steady intervals from just above 10% en 1962 to a low of 4% en 2012. I_______________n, m______gyc_____________njobs wereg_______________e con m_______________h, r____________m 9% y 1% a 10% y 2%, respectivamente.